
Introduction
In Part One of this module, students will be introduced to the theoretical behaviours (of oscillation) needed to interpret patterns within the physical world as signals. At this level, the focus is on being able to read simple signals, and to understand that complex signals, although imposing in appearance, can be also be read.
Signal processing forms the foundation of the multimedia revolution, so there’s no shortage of applications, but in terms which may resonate with students: today’s storytellers may wish to use historical photos as part of their stories. These photos might be damaged, degraded, or poorly recorded. Signal processing gives you the language and awareness to navigate the enhancement and recovery of these photos for future use.
The main objective of Part One is to teach students the three core behaviours of oscillations: origin, amplitude, frequency. With this information, the goal is for students to learn to see these patterns in the world around them.
Some Questions to Ask Yourself
- How do Instagram filters work? How do they change your original photos into what you see?
- When you remix a song on the computer, how does that work?
- How does NASA get such sharp images of Jupiter and Pluto? Especially when they’re so far away?
The Audacity example allows you to record a signal in real-time, and inspect its waveform up close to relate it back to the wave theory given in the learner section.
What is Signal Processing?
Let’s use a few examples to explain: When you Photoshop an image, do video or sound editing, or when NASA shows us clear images of Pluto or Jupiter, that’s all done with signal processing.
There is a lot of software that gives you the tools to do these kinds of things. This module is about learning how these tools work. The more knowledge you have, the deeper your understanding, which allows you to do better work, and perhaps in the future you can use this knowledge to make your own tools. Knowledge of signal processing can help with your community, your friends, your family.
Learning Style
How do you learn? I will explain my way:
Motivation (will) + Intuition (mimicry) + Storytelling (memory)
For me, motivation, intuition, storytelling are members of my community, and they help each other out. When I’m self-learning, first I try to figure out which of these three I feel closest to. The one I feel closest to is the one which will help me build a stronger bond with the others. Of course these aren’t the only members of my community, and I certainly learn from people around me in the same way.
As for self-learning, if you’re curious about my way, I have examples. Mostly, I thought I should discuss my way because it’s also how I teach, including how I present this module. What’s your way?
Learning Style Examples
Hunting
I am an urban Inuk. I have been my whole life, so I don’t know as much about hunting as I’d like. There are no hunters in my life to learn from, either. I might not be able to teach myself everything, but I feel I should try to teach myself some things.
When it comes to self-learning, my will is motivated to start: It could someday help me reconnect with and serve my community, and it would help me to be more capable and resourceful. As for stories: I don’t have any to tell, but with motivation I could spend time finding and learning the stories of others. Stories help me to remember, especially when I lack the experience. As for intuition, because I lack experience, I don’t know if I have any instinct for hunting, so I couldn’t say at this point. I do have years of experience mimicking though, and if I went on the land I trust that I could use my motivation and the stories I would know by then to help me build that intuition to better understand and be respectful to our animals.
Women’s Studies
I have spent much time reading information about women’s studies and have learned much from it. I admit I did not have much motivation when I first started. A big reason I had little motivation was because I had even less intuition. It’s things women are interested in, right? I actually had a small motive and instinct about it though: I knew it is important, even if I didn’t know why.
I observed many women around me talking about these issues, and I could see their passion. They told me these understandings are important to everyone. So I didn’t have strong personal motivation at first, but even so: I wanted to be respectful and fair to the women in my life. I was taught you should not interfere with the inner way of another, and although I have no intention of interfering, I realized the less I know, the more likely I am to interfere out of ignorance, even if that is not my intention. You don’t know what you don’t know. We all have blind spots. There are lessons we’re not taught even when we should be.
Because of this, I have spent time learning women’s stories, and women’s truths, to help me remember. It has helped me begin to build an intuition because I can now start to see the connections and common patterns in their truths. As I continue this way, I find I am developing a strong motivation. Women’s studies are important because they help me to offer higher forms of justice to my community, and I will continue in these studies because this kind of learning is lifelong.
Mathematics
Not everyone likes math. I understand.
I like math because I have strong intuition for it. I often learn a new fact and say to myself: “Oh, that’s interesting!” and because I have a natural interest, motivation also comes easily.
To tell you the truth, even though I have strong intuition and motivation for math, there are often many details to remember, and that part is not always easy for me. Sometimes it’s a bit boring to learn many details at once, or it’s hard to see the connections between the ideas at first. In these cases, I look for a story to tell. I ask myself: What story is being told? This is especially true when I’m reading. Even authors of math are telling stories, although it might not be obvious right away.
Once I find a story that’s interesting, it helps me remember the details. And even when I don’t remember absolutely everything, I can research the forgotten detail with a book or a web-search and the story I’ve learned helps me quickly find that reference.
This is my way of self-learning, and now that I have given these examples I ask: What’s your way?
Oscillations
Oscillations make the language of signal processing.
The word oscillation is fancy, so what are some other ways of describing it? It’s like: back and forth, or on repeat but allowed to be a little different each time. Take a look at this oscillation game to get a better idea.
Instructions
To play this game with another, you control the oscillation (drawing a circle with your hand in the air, or with a pencil on paper) while your partner sings, raps, dances, or just reacts rhythmically to it!
- If you make the circle bigger, they have to get louder or more intense.
- If you make the circle smaller they get quieter or less intense.
- If you make the circle faster, they have to sing at a higher pitch or react faster.
- If you make the circle slower, they have to sing at a lower pitch or react slower.
Do they have good rhythm? Can you make it harder for them as you play? Have some fun with it!
To control the oscillations: use the buttons below the the empty white box below.
To play this game with another, you control the oscillation while your partner sings, raps, dances, or just reacts rhythmically to it!
- If you make the circle bigger, they have to get louder or more intense.
- If you make the circle smaller they get quieter or less intense.
- If you make the circle faster, they have to sing at a higher pitch or react faster.
- If you make the circle slower, they have to sing at a lower pitch or react slower.
Do they have good rhythm? Can you make it harder for them as you play? Haha.
The important thing to know for now is that oscillations have three main behaviours:
- Oscillations have a point where they repeat. This is called the period, but usually we’re interested in how often the oscillation repeats over time. This is called the frequency and it’s so common it has its own measurement name: Hertz, which means how many times it repeats per second (cycles per second).
- Oscillations have an intensity or height. This is called the amplitude, and in terms of the oscillation game, it’s how big the circle is (the radius).
- Oscillations have a neutral or inert or equilibrium point. This is called the origin. In terms of the oscillation game, it’s the initial circle when you start, which is to say the middle sized circle.
So that’s the basic idea of an oscillation. It matters because it forms the basic intuition for a signal.
Waves
Waves are another way to look at the three behaviours of oscillations we just discussed. The oscillation game let us interact with an oscillation in the moment, but sometimes we want to take a step back and look at that oscillation as a whole and how it changes over time. Sometimes we want to feel its flow so we can mimic it better. That’s what waves let us do.
Sine Waves
We start with the simplest wave, the sine wave which looks like this:
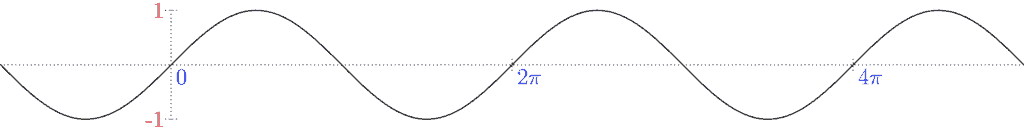
If you’re unfamiliar with graphs, I’ll explain: The curve in this graph is the wave, and the horizontal and vertical lines tell the story of a relationship. Here, the horizontal line offers the relationship of time, and the idea is as you look left and right on that line, you’re going backward or forward in time. Then for each moment in time you can look up or down from the line to see what the wave is doing and how it’s changing. Can you mimic this story?
As I said above, waves are another way to look at the three behaviours of oscillations. Here’s how:
- Oscillations have a point where they repeat called the period, as well as a rate of repeat called the frequency (measured in Hertz). If you look at the sine wave above, you’ll notice it repeats as time goes on. This is the period of the wave. The above graph says the period is 2π. This is true, and I will explain why later on, as it uses a bit of math we haven’t covered yet.
- Oscillations have an intensity or height called the amplitude. I mentioned that the horizontal and vertical lines in the graph offer relationships. The vertical line shows the amplitude. For example, if you go back and forth through time (along the horizontal line) and at a moment in time you look up and see the wave is very high, this means its amplitude is high. The wave pattern indicates that the amplitude goes up and down with time.
- Oscillations have a neutral, inert or equilibrium point called the origin. With the sine wave, the back-and-forth relationship happens across the amplitude (up-and-down), so the origin belongs with that relationship. If you look at the middle, that’s the location of the origin. Every time the wave passes through the origin it’s at equilibrium for a brief moment. It just happens that’s also where the horizontal line is.
So that’s the basics of sine waves.
Complex Waves
If we really want to understand signals we need to know about complex waves. We started with sine waves because they are the simplest wave, but there’s a second reason: complex waves are also made from sine waves.
The Breathing Sine Wave
How does a sine wave breathe? In more than one way it turns out: Through its amplitude as well as its frequency.
Why do I say this wave “breathes”? If you pay attention to your own breath, have you ever noticed it oscillates too? When this wave’s lungs are at rest, it is the original sine wave. As you grow or shrink the amplitude (or frequency), you still have the sine wave, but it looks different based on how much it’s inhaled or exhaled.
I’m going to start using some math notation now, so if you’re unfamiliar with things like 2·sin(t) or sin(3t), here is a quick explanation of functions which I hope helps.
Functions Explanation
Functions, more than anything, are about describing a certain kind of relationship. They basically just say that for certain kinds of input, you have certain output.
Names
The trickiest part to get used to is the math notation (or, style of writing) people use. The thing to know about math notation is that us “math people” often have so many different names to look at when we’re doing math, it becomes too difficult to come up with an original name each time we want to discuss something new. Because of this, we end up with a more complicated and deeper understanding of names than we might at first prefer. Don’t let this scare you though, it just takes a bit of time to get used to.
To begin, some names are so important we keep them the same no matter what, and we call these constant names, or just constants. For example the name sin(t) is short for the sine function, which describes the sine wave of signal processing. For names we wish to be reusable, we call variables. So in one instance, we might say the name t refers to the number 5, which is to say t=5. In another instance we might say instead say t=2.2.
If in the future you ever read other people’s math, I should warn you, the tricky part is that math people don’t always make it clear if a name is a constant or a variable. Overall we try, but sadly we sometimes make mistakes; sometimes we are unable to foresee a misunderstanding, or we don’t think ahead enough to anticipate the reader’s needs.
What’s even trickier is that we care so much about reusing names we recycle ones you wouldn’t think possible. For example, take the expression a·b. If a=3, b=7 then the operator ‘ · ‘ means we multiply these two numbers. But a, b don’t have to be numbers. In math there exist objects called matrices, and the expression a·b still makes sense, but not how you think. It makes sense because ‘ · ‘ is no longer the normal multiplication you’re use to doing. This is to say, we even reuse these symbols as names.
I apologize about this warning, I don’t want to scare you. We won’t be doing this kind of “scary math” in these modules. I just want to give you a heads up in case you choose to study math as part of your self-learning. If you’re unaware of these things going in, it can make things very confusing. The saddest thing is when you think something is harder than it is, only because you don’t have a good story to understand it.
In any case, I still have a few more things to say about names: When names are variable, they can also be interchangeable. Again, with sin(t) we could also write sin(x) or sin(z). The sin( ) part is constant, while the t, x, z variables are interchangeable because they don’t change the meanings of the relationships behind the function.
Finally, math people make a distinction between direct names and indirect names. This happens in regular language too. For example, “my cousin” is a more direct name than “my father’s brother’s child”. Both refer to the same person, but one is more obvious while the other requires you to work through the logic first. This example uses English words for family relationships. What’s it like in your language? In your culture?
Function Names
How do names relate to mathematical functions? As I had stated at the beginning, functions describe relationships between input and output. So let’s say you have some Inuit tools as input, such as an ulu, for example. Let’s say our function is to translate the input into English, then the output is a simply the word knife. Certainly there are better more accurate descriptions, but those would make up different functions. Even if similar, the function we describe only outputs simple one word translations.
Now, because our usage of names can be confusing, I’ll summarize how we use names within functions:
- We use variable names to describe the input of a function. So with sin(t) we have the t variable name as input.
- When describing function names, we sometimes use variables, and other times use constants. So, as noted previously with the sine function, the name sin( ) is a constant. To contrast this, we might use the name f( ) as a variable for some function we want to describe in a given moment—while at a later time we might end up reusing this same name to mean another function altogether.
- We use both direct names and indirect names to describe the output of a function. So with sin(2π) we are using an indirect name to describe the output. We are saying: “The output that results from the sine function with 2π is its input”. Of course we could directly describe the output as 0.
I hope this name theory helps. Also, if you want to know a fancy word for a name theory, I suppose you could call it nomenclature.
Anyway, here’s an example of the breathing sine wave:
2·sin(t)
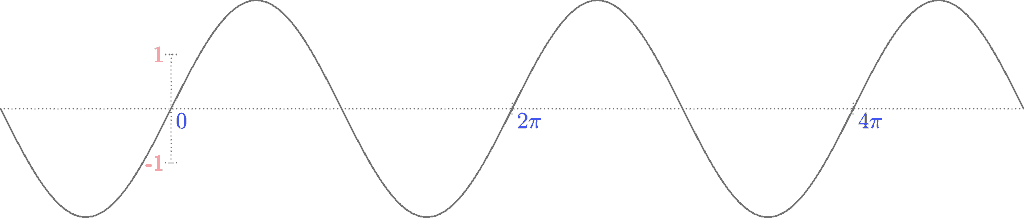
In this wave, the amplitude has inhaled to double its size. If you look at any moment in time along the wave, the amplitude is twice as far from the origin as it use to be. Notice how the wave now goes past the numbers -1, and 1 on the vertical line? Here’s another example of the breathing wave:
sin(3t)
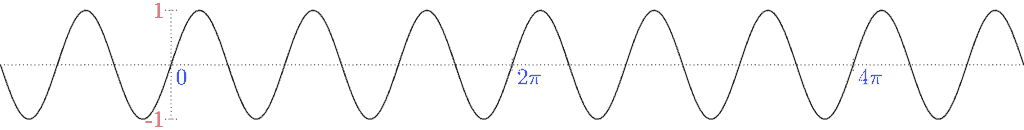
In this wave, the frequency has inhaled, and has tripled its speed, as it has more energy. When we write sin(3t) we’re saying it now only takes 1/3 the work to go as far in time as before. What it means for the wave is that its period is also 1/3 of its original length. We also say it’s three times as frequent. This is the relationship between period and frequency: you get one by flipping the other (3 to 1/3, 1/3 to 3).
Building Waves Up
Now that we know how the sine wave breathes, how do we make complex waves from it? We add different breaths!
2·sin(t) + sin(3t)
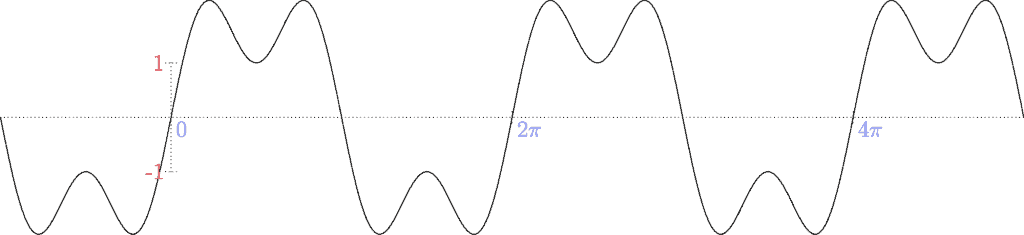
Neat, huh? If we want to make really, really complex waves, we need to add many, many breaths together:
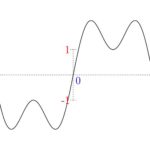
2·sin(t) + sin(3t) + 1.5·sin(4t) + 0.75·sin(6t) + 3.05·sin(15t)
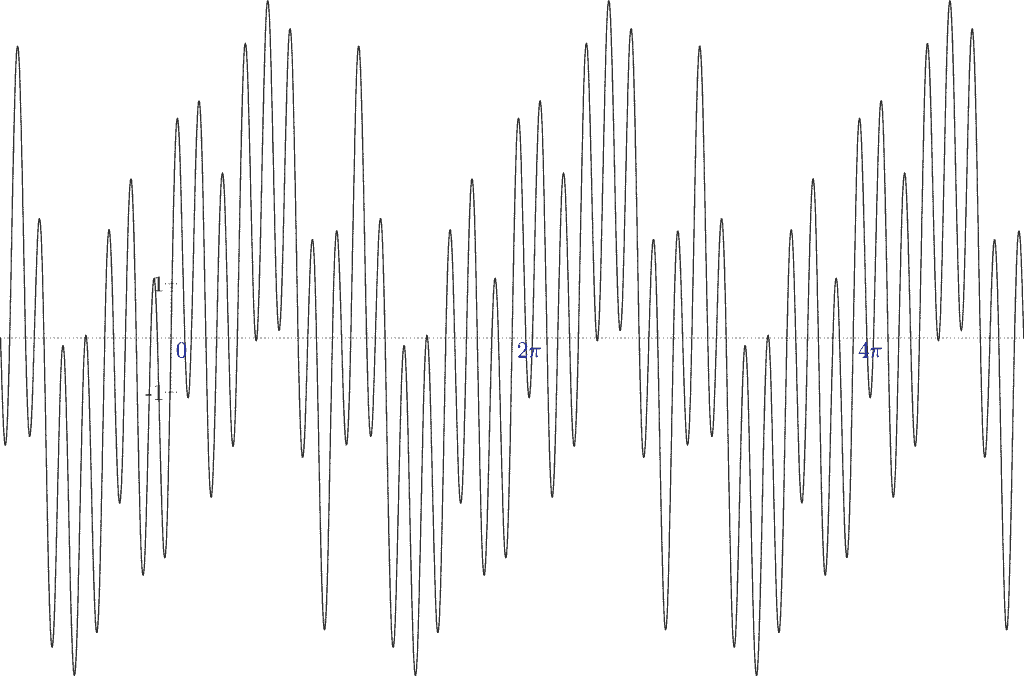
When looking at these complex waves, have you noticed how each breathes in a different way? Some take deeper breaths, some shallower ones, and those differences are in both their amplitudes and frequencies. I wonder what would happen if you added even more waves?
Breaking Waves Down
Now that we know how complex waves are built up from sine waves, you might wonder if we can break them back down. That is, if you were handed a complex wave like the example above, without knowing how it was built up, could you figure out how to break it back down? If you could, would you want to? What’s the value in that?
The short answers are: yes it is possible to break complex waves down; yes you would want to; because it’s important. The long answers are the real answers to what signal processing is actually about: being able to break down waves allows us to know about the individual frequencies that make up the waves. Signal processing is made up of many valuable tools, but this is its most clever and important one.
Signals
We know enough now about oscillations and waves; it’s time to talk more about signals. I said that oscillations make the language of signal processing, so if that’s true, what is a signal? For our purposes, the best way to explain it is: if you can record it, it’s a signal. Once you realize this, you can actively look at recordings and try to reinterpret their relationships as oscillations. When you graph these relationships, you’ll discover they look like the complex waves we’ve been studying.
Actually, this brings back a memory for me: when I was growing up, my parents told me “don’t be wasteful!” Because of this—over time, with practice and the occasional reminding—I learned that many things can be reused in ways they weren’t intended. Figuring out how something could be repurposed meant the thing would live a better life because it could be more useful to its community, and I was better able to serve my community because it made me more resourceful.
Signal processing is like this too. If you’re willing to reinterpret the world around you, and if you know how to reimagine and reuse new ideas, you will discover there are signals all around you, and they’ve been there the whole time. We’ll end this module by looking at two specific and important examples.
Audio Processing
You might have already guessed (if you didn’t already know): sound recordings are signals. Let’s go over the details about why, but first, as a reminder: the three main behaviours of an oscillation are its period/frequency, amplitude, and origin.
Sounds are made through the air, so how do we record them as signals? Air pressure! The idea is that when sounds are made, the air pressure momentarily oscillates, so if you record those oscillations in air pressure, you end up with a signal which can be viewed as a complex wave.
The greater the air pressure, the louder the sound, and the greater the amplitude. What about the origin? What is the neutral air pressure? The air pressure of the room you’re in! That’s the equilibrium, and every other pressure deviates from it. Have you ever blown air into a flexible container, like a plastic bag or balloon? When it’s inflated, its pressure is more than that of the room. When you suck air out, its pressure is less than the room.
As for frequency, it is similar to the idea of pitch in music. If a sound has a higher frequency, it has a higher pitch: the air pressure is oscillating more rapidly. If a sound has a lower frequency, it has a lower pitch. I want you to try something: cover your ears and make a humming noise with your throat. Focus only on the humming noise. Notice how your throat vibrates? How higher hums vibrate more frequently? How lower hums vibrate less frequently? Vibrations are oscillations too.
I could give more examples using sounds generated by the human body, but the bigger picture is: the world is full of sounds! Which is why I focused on air pressure. But it’s actually even more complicated than this though, because sounds can be made in the water too, or in any physical material that conducts sound waves. That’s why it’s more important to know how to find the behaviours of oscillations instead of just learning about the physical materials that allow for sounds. The physics might change, but the theory of oscillations stays the same.
Anyway, that’s the interpretation of sound as waves. It is the starting point for audio signal processing.
Since examples are helpful, we’re going to create an example using Audacity to demonstrate these ideas.
Audacity Example
If you want to try this out for yourself you’ll need Audacity, and you’ll need to have a microphone to record from. If you have a laptop it’s likely you have a microphone built in. If you have a desktop you’ll probably need to have a seperate computer mic to plug in.
If you don’t have Audacity, it’s free to download!
Also, if you don’t know how to use Audacity, don’t worry, it’s very easy!
Let’s Record!
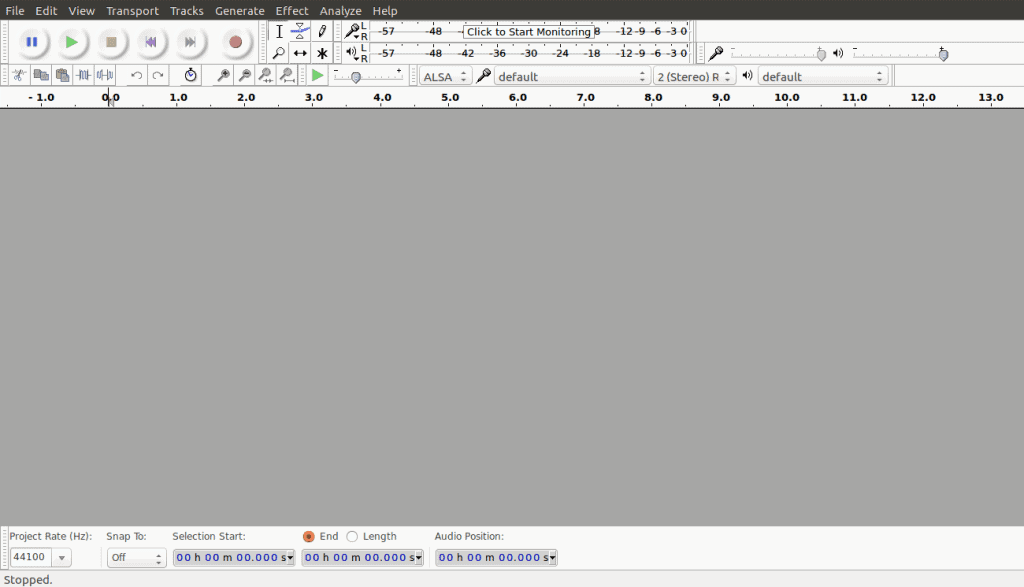
Once you have Audacity installed and a working mic ready, start by opening Audacity:
We can start our recording right away, just find the Record button, which looks like this:

Press it! Now you can speak into the mic. Just keep talking or making continuous noises, singing maybe; it doesn’t matter what you say, you’re just trying to record some sounds.
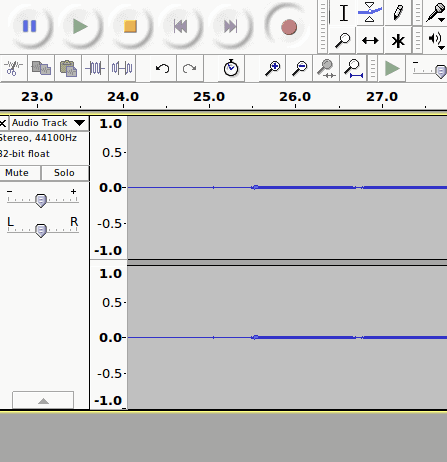
If you don’t like your first recording, just press the × button next to the Audio Track to delete it, then start over. If your setup is like mine, you will see something similar to this once you’ve made your recording:
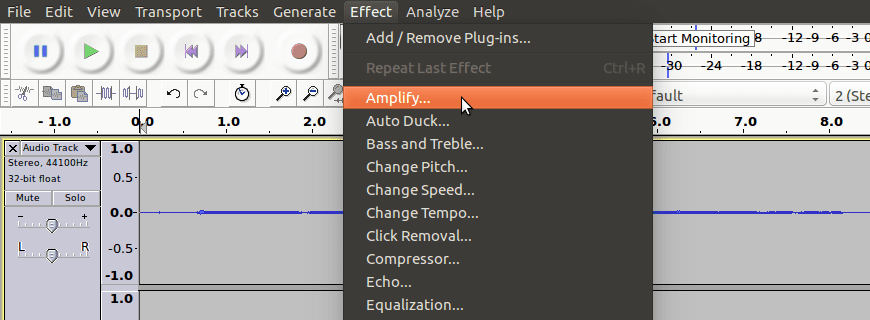
Notice that the signal is very small. For our purposes, we will amplify it so that it becomes large and easy to see. To do this, go to the Effect menu, and select Amplify…:
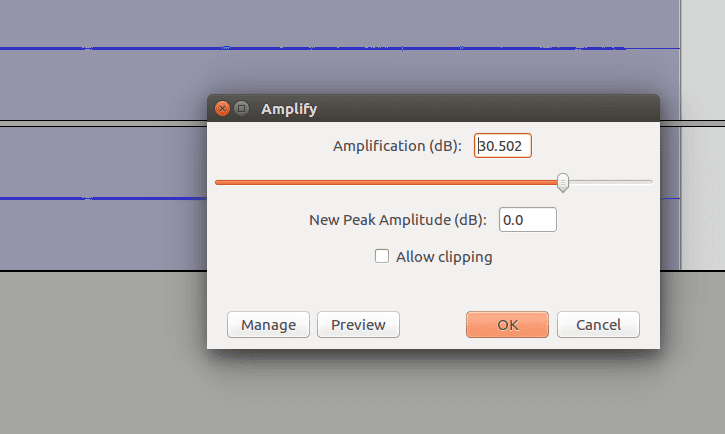
Audacity should already suggest a number for the Amplification. The number you see will likely be different than mine, but that’s fine. Press OK.
Now your recorded signal should look much larger:
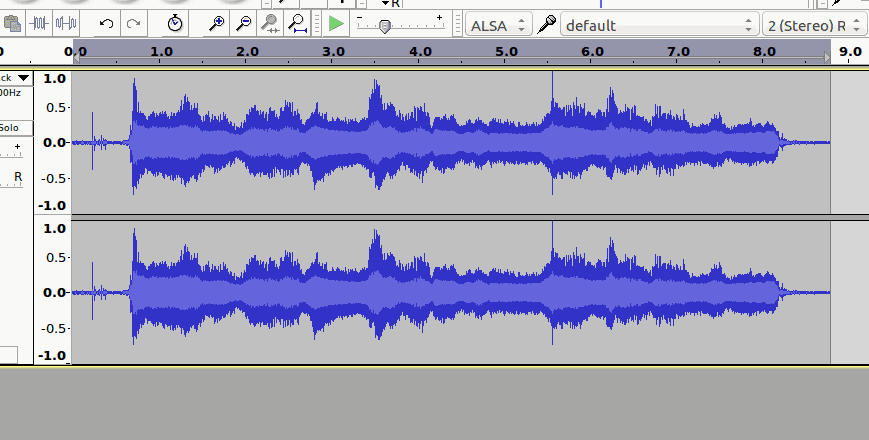
So what happened? How does this relate back to our oscillations, waves and signals? When we amplified, we increased the amplitude of our signal throughout the whole time axis. If you listen to this amplified recording, it will sound much louder than before. Go to Edit > Undo to listen to the original. To return to the edited (amplified) signal click Redo, next to Undo in the Edit menu.
I mentioned earlier that the most clever tool in signal processing is being able to break down waves to see the individual frequencies. When we break down waves, we can also see the individual amplitudes, but the amplification effect brings up an important point about signals: amplitude doesn’t matter as much as frequency.
Why? When we listen to the loud or quiet versions of our recordings, people will generally say they’re the same, just at different volumes. If we instead change the frequency of our recordings, they sound different. You might say it’s a similar recording, but people will likely still feel the recording itself is different. There’s a whole line of thinking called perception which we won’t get into here, but I thought I would leave this general observation as something for you to think about.
Getting back to our example, here’s where the fun begins. Highlight a very small portion of your recording:
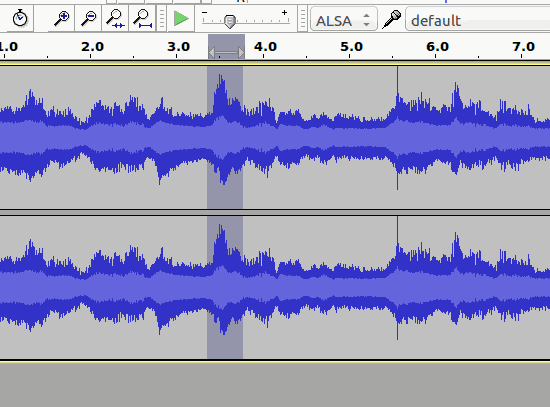
And then magnify with the Zoom In button:

Keep pressing the button until you zoom into the signal to the point where it looks like this:
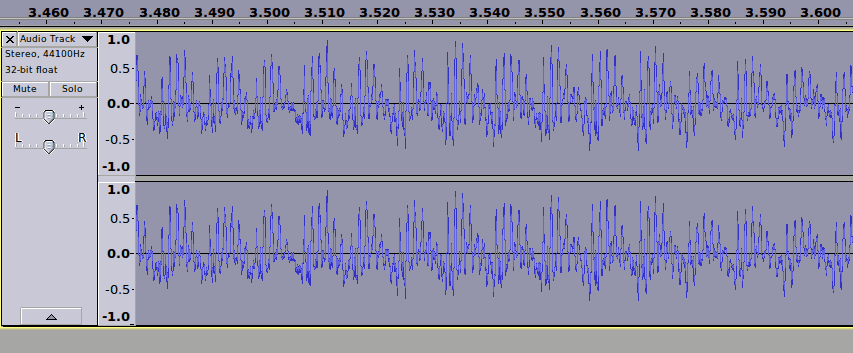
Notice how this looks like our complex wave examples, especially the final example? Now let’s look even closer:
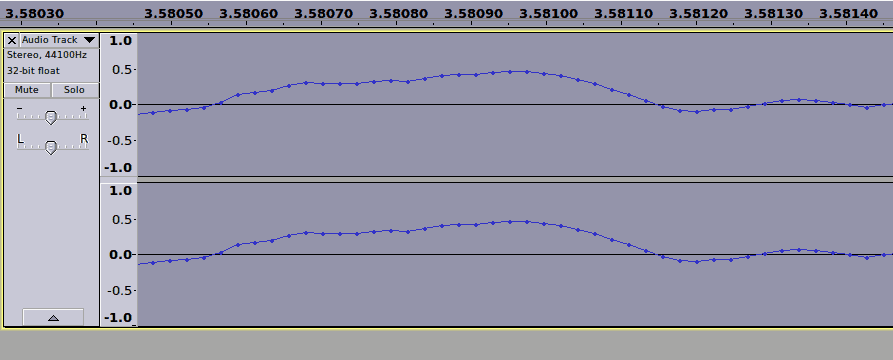
What can we say about this wave and how it changes now that we’re looking at it in detail?
We’ve already discussed amplitudes, so let’s talk about frequency a bit more. We’re not ready to break down our signal into its precise frequencies just yet, but we can build a bit of intuition for it. In particular, the parts of the signal where the wave changes slowly—like between times 3.58090s and 3.58100s—are made up of more low pitch frequencies, while the parts where the wave changes quickly—like between times 3.58110s and 3.58120s—are made up of more high pitch frequencies.
This might not seem obvious. How do I know this then? To really understand it, you need to know more about signal processing actually. But I’ll try to offer my intuition: it’s like, if you want to move quickly from one amplitude to another, how could you do it?
If you look at low frequency waves, they transition slowly through their amplitudes. If you look at high frequency waves they have to transition quickly in order to complete a full oscillation in the small amount of time they’re given. If you’re looking at a complex wave, and there’s a part of it that moves quickly, this suggests that when you break the wave down into simple waves, you should have some high frequency waves in there, otherwise the wave as a whole wouldn’t be able to move so quickly.
In any case, this ends our Audacity example. Hopefully it motivates you to study more. In the meantime, we’ll be moving onto an image processing example.
Image Processing
Images are signals too!
This actually surprised me when I first found out. I didn’t have an instinct or intuition for it. My disbelief made me curious. Can you guess how it’s true? If you can and it makes sense to you, I’m envious of your intelligence!
If you’re more like me and you don’t see it yet, I’ll give you the answer: spatial frequencies! If you’re unfamiliar with the word spatial it just means “space”, like the regular physical space around us. If that’s true, you might ask: how does space have frequencies? I certainly asked that question when I first found out.
As with audio, we look to find the three major behaviours of oscillations (amplitude, origin, frequency) that we know, but using images as our signals. To figure this out, we need to look at what makes an image an image. When it comes to digital images on our computers or smartphones like photos, pictures and graphics, an image is just a rectangle of coloured pixels. So how do we interpret a rectangle of coloured pixels as a signal?
Let’s make things simpler. Instead of a coloured image, such as this one going from blue to orange:

Let’s work with a black and white image:

These two images are called gradients. They visually show a spectrum of two colors (or shades) that transition smoothly from one end to the other. They may not be the most interesting examples, but they are still images, and they do offer insight into how images oscillate.
As for interpreting oscillations within images, we’ll start with amplitudes. When we looked at the simple sine wave, we looked to see how far the curve was from the origin, and this was its height, or amplitude. One thing we didn’t really get into is that as a wave changes over time it has a maximum height and a minimum height, and as it oscillates it goes smoothly from one end to the other. Now that we’re talking about gradients, they kind of seem the same way, don’t you think? The difference is that our gradients don’t oscillate, but what if they did?
I present to you an oscillating gradient:

We have our first success! And now that we know how amplitudes work when it comes to images, let’s figure out what it means for them to have origins: in this case our origin is the midway between the maximum and minimum values, which here would be the gray. Our second success!
At this point, you might agree that there are similarities with waves, but there are also differences:
- With waves, there’s only two directions: backward and forward. With images, if you picked any pixel in the image, there are 360 degrees of directions!
- With waves, as you travel back and forth, you are looking backward and forward through time. With images there are 360 degrees of directions, but none of them let you go back and forth through time! (Wouldn’t that be cool if they did though?)
Since all of this is true, here’s what we can say about it:
- It does not matter how many directions a wave has when it comes to signal processing. In the case of images, you can pick any point on an image, head in any direction, and the image oscillates. Of course, different directions mean different patterns of oscillation! And if its a complex image signal, you might not see the repeating pattern until you break it down into its simple image waves.
- When it comes to audio and other 2-dimensional signals, the directions along the wave are usually given in units of time, and that’s how I introduced them, but they don’t have to be that way. When you extend signals to 3-dimensions and higher (yes, there are higher dimensional signals), direction is often given in units having nothing to do with time. In the case of images, direction is given in terms of spatial direction, which is why we talk about spatial frequencies. By the way, when direction is given in terms of time, we talk about temporal frequencies.
That’s pretty much it for how images can be viewed as waves, except we left one part out: Color! We “cheated” by making things black and white, so how do view color images as waves?
Unfortunately I can’t tell you the full story in this module, because it requires color theory which is another topic entirely. I can tell you this though: every color can be split up into three primary colors: red, green, blue. For example a particular shade of orange is created as 100% red + 65% green + 0% blue.
Since we can do this for any and every color, we can split up our image into three images: red image, green image and blue image. The pixels of each image would be the percentage or shade of that image’s color. So if we return to our original blue to orange gradient, we’d split it up into its red, green, and blue versions and then figure out what kind of waves are in each separately.

Final Thoughts
So that’s it for this module. I hope the stories I gave here are helpful to you in your journey, and that they help you help others. If you still want to know more, and if you’re comfortable with more math, there’s another story to tell in part two.
One of my favorite writers says the following at the end of some of her writings, so I will try to be respectful and copy her. I will end by saying: Pijariiqpunga.
Resources
- Sonic Visualiser – An open source tool similar to Audacity. It doesn’t let you record or edit audio, but it lets you analyze it using much more powerful tools, and an easier-to-use interface.
- A Tribe Called Red – An Indigenous music group that remixes traditional First Nations songs with Dubstep and other Electronic genres.

