

Overview
In this lesson, students read a scientific journal paper, examine charts and graphs, and try to decipher data from them. Students extract useful information from the texts and put meaning to the graphs and numbers.
Learning Objectives
- Read the scientific text and demographic charts from the published paper
- Write a report based on understanding of the journal
- Discuss the findings and explore solutions to mitigate the impeding factors
Curriculum Links
Ontario: Reading, Writing, and Media Literacy
- 1.2 – Developing Ideas
- 1.2 – Making Inferences
- 1.3 – Research
- 1.3 – Responding to and Evaluating Text
- 1.4 – Demonstrating Understanding
- 1.5 – Making Inferences
- 1.6 – Extending Understanding
- 1.7 – Analyzing Text
- 3.4 – Producing Media Texts
- 4.1 – Metacognition
- 4.3 – Portfolio
Nunavut: Uqausiliriniq
- Communication
- Language
- Creative & Artistic Expression
- Reflective & Critical Thinking
Reading Activity
Historical Comparison of Gender Inequality in Scientific Careers across Countries and Disciplines
Gender differences in academia, captured by disparities in the number of female and male authors, their productivity, citations, recognition, and salary, are well documented across all disciplines and countries. The epitome of gender differences is the “productivity puzzle”—the persistent evidence that men publish more than women over the course of their careers—which has inspired a plethora of possible explanations, from differences in family responsibilities to career absences, resource allocation, the role of peer review, collaboration, role stereotypes, academic rank, specialization, and work climate.
The persistence of these gender differences could perpetuate the naive interpretation that the research programs of female and male scientists are not equivalent. The following charts provide a background and comparison between the gender gaps in STEM careers across many disciplines and countries.
Source: Huang, J., Gates, A. J., Sinatra, R., & Barabási, A. L. (2020). Historical comparison of gender inequality in scientific careers across countries and disciplines. Proceedings of the National Academy of Sciences, 117(9), 4609–4616.
Discussion Prompts:
- After reading the text and looking at the graphs, what factors do you think might play a role in gender bias in the scientific community?
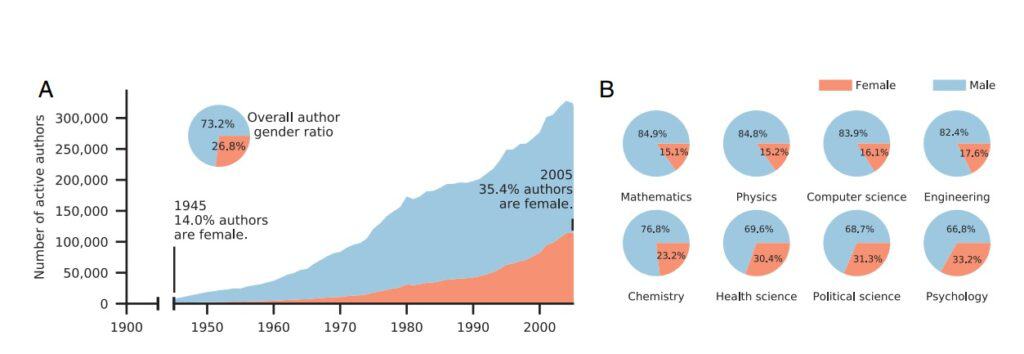
- Figure A shows that between the years 1945 and 1960, there were no published female authors. Why do you think that is?
- After 1960, female authors started to publish in scientific journals. What factors were likely involved that encouraged women to pursue careers in science?
- Figure B shows that women’s contribution to published work is still very low across many disciplines. Do you think females are discouraged from pursuing careers in science? Do you think STEM resources are targeted to the male population?
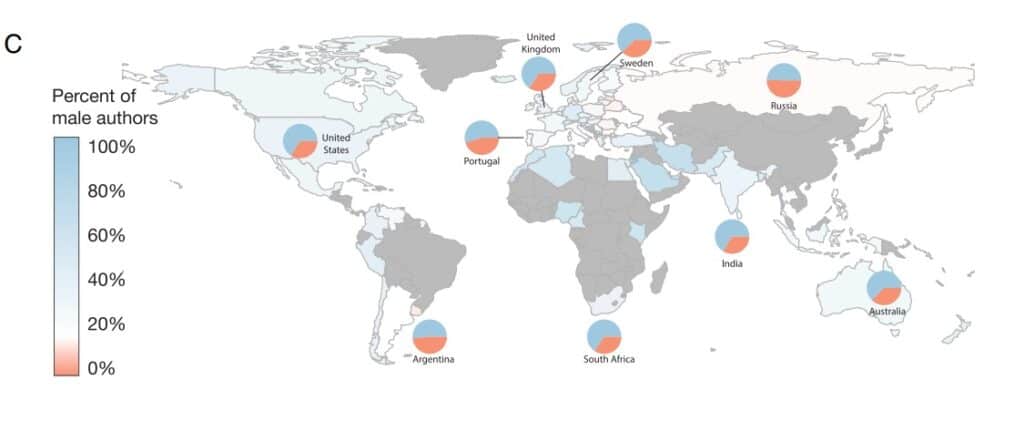
- Figure C shows the comparison between male and female published authors across different countries. It is interesting to note that in the United States and Australia, a little more than a quarter of the published authors are female while in Russia and Argentina, it is almost half. What do you think are the factors that discourage or hinder women’s contributions to science, particularly by country?
- Figure A shows that between the years 1945 and 1960, there were no published female authors. Why do you think that is?
Next, encourage students to explore various factors that contribute to less female representation in STEM careers. Ask:
- How many of the female students aspire to careers in science? Why? Why not?
- What do they picture when they think of a scientist? Do they picture a male or a female?
Computer/Tech Activity
After the class discussion, ask students to write a report on their findings and conclusions using APA format.
APA Paper Formatting Basics:
- All text is double-spaced
- Use one-inch margins on all sides
- All paragraphs in the body are indented
- Centre the title on the page with the student’s name and school/institution underneath
- Use 12-point font throughout
- Number all pages in the upper right-hand corner
Provide the students with a list of female scientists and ask them to create a career profile highlighting the women’s work and contributions in their field. Students can also choose from the following list:
- Hayat Al Sindi
- Marie Curie
- Ismahane Elouafi
- Rosalind Franklin
- Maria Goeppert-Mayer
- Dorothy Hodgkin
- Katherine Johnson
- Irène Joliot-Curie
- Hedy Lamarr
- Romani Makkik
- Barbara McClintock
- Shannon O’Hara
- Betsy Palliser
- Carla Pamak
Students can also choose a female scientist from their country or region and create a profile. Here is an inspiring profile of Shannon O’Hara (Inuvialuit Settlement Region), Romani Makkik (Nunavut), Betsy Palliser (Nunavik), and Carla Pamak (Nunatsiavut), who are the Inuit Research Advisors for their respective regions. Students can learn more about their research and fields of study on the Government of Canada Website.
Conclusion
This exercise allows students to extract and decipher information from scientific texts and draw conclusions. More often than not, information in published journals is highly technical and difficult to unpack. Through this lesson, students gain insight into how journals are written and what kind of information can be extracted from charts and graphs. It also allows the students to explore various factors that might encourage women to pursue careers in STEM fields.
Resources
Pinnguaq Resources
- Arctic Advocacy Podcast
- Beyond Ones and Zeros Podcast
- Space Careers: Abby Lacson
- Beyond Blathers: Science in Modern Media (Part 1)
- Beyond Blathers: Science in Modern Media (Part 2)
